[From the last episode: We looked at CNNs for vision as well as other neural networksA type of conceptual network organized in a manner inspired by our evolving understanding of how the brain works. for other applications.]
We’re going to take a quick detour into math today. For those of you that have done advanced math, this may be a review, or it might even seem to be talking down. That’s not the intent; I’m trying to make this accessible to people that are less mathematically inclined or with less background. So we’re going to hit some real basics as we go, just to be sure.
We’ve seen the notion of a convolutional neural networkA type of artificial neural network specifically used for machine-vision applications., and that raises the inescapable question, “What is a convolution anyway?” Usually, when something is “convoluted,” it’s unnecessarily confused, messy, and complex. And… that’s not completely off the mark for the math function. Except for the “unnecessarily” part.
This function is quite abstract, from the standpoint of a non-specialist. You would be justified, in my humble opinion, in asking, “Who the heck thought of this? And what was the inspiration??” I wonder that myself. But it’s used in many different fields, so it clearly has a role.
Functional Review
Let’s start with some quick math review: functions are… formulas that have some simple basic properties. If you took algebra, you may recall that you can express some function y in terms of some variable x. We say that y is a function of x. A simple example of a function is:
y = x + 2
which means that, whatever x is, y will be that plus 2 more.
In order to reinforce that y depends on x, we often make that more explicit by writing
y(x) = x + 2
and calling the function, “y of x”.
That means that we can plug any numbers we want in for x and then we know what y will be. If x is 1, then y is 3; if x is 25, then y is 27. Critically, for any value of x, there can be only one correct value for y. (That might sound obvious, but there are formulas that don’t have that property, and, therefore, they’re not considered functions.)
We can plot a graph of, as we would say, x vs. y, which will give us a visual feel for how the function looks. The graph below plots values of x along the horizontal axis (often called the “x axis”), and then we plot the result along the vertical axis – also called the y axis (simply by conventionAn agreement on some decision that could be made several ways. For example, given a single bit, you could decide that 1 means "true" and 0 means "false," or you could decide the opposite. Similar in spirit to a protocol, but protocols usually deal with how something is done -- a step-by-step process, for example. – there’s nothing magic about those two letters).
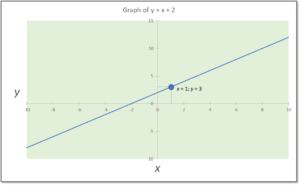
So you can see that, at the point where x is 1, there’s a point on the line where y is 3. If we went all the way out to 25 for x (which we didn’t – we stopped the graph at x = 10), we would see a point on the line at y = 27. Because x can be any value along the line, we have infinitely many points on our graph, so instead of individual points, we show it as a straight line.
Every function creates some kind of shape on a graph like this. In this case, it’s a straight line. But it could be a curve or something very complex. We’re not going to get into the various shapes; it’s enough for now simply to know that each function has a shape.
Put Your Thang Down, Flip It, and Reverse It
Why do we need to know that? Because convolution is best understood by thinking about these shapes. Let’s say we have two functions of x: F(x) and G(x). Each function will have a shape. So… here comes the weird part: to find the convolution, you take one of the function graphs, reverse it left-to-right, and then slide it along over the top of the other function. You then calculate at each point during the “slide” how much the two functions overlap. Because that overlap varies as you do the sliding, you’re not getting one numeric answer: you’re getting yet a third function, which is the convolution.
I could attempt to illustrate this visually, except that Wikipedia has already done a pretty good job of that. So I encourage you to look at that page; they show the flipping, sliding, and overlapping.
So… what the heck does this have to do with machine learningMachine learning (or ML) is a process by which machines can be trained to perform tasks that required humans before. It's based on analysis of lots of data, and it might affect how some IoT devices work.?? Well, we do this with matricesAn array of numbers, having both rows and columns of numbers. Widely used for many complex tasks. that represent so-called filters (also called kernels). If we look at an image, it’s a bunch of pixels, each of which has a value – representing the intensity, perhaps – for each color. Instead of taking each pixel, one at a time, we instead take a square group of pixels, which acts as a window, and we do the following calculation: multiplying the pixel value by the corresponding filter value, for each pixel in the window, and then adding all of the results within that window together. It’s almost like averaging the numbers within the window, except that you have the filter to consider as well.
A Super-Simple Example
Let’s assume the pixel map shown below. I’ve simply made up numbers for it to show how this works. This could be, for example, for one color. We show only a 4×4 image – which is ridiculously small – for this example. In reality, the image would be much larger (like, a million cells).
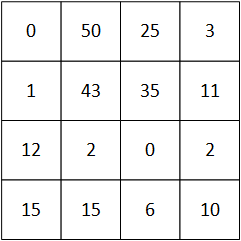
We’re going to use a 3×3 window and filter for this. So the first time we do it, we start at the top left; the square below indicates where the window is.
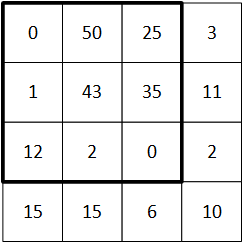
We now do the calculation for that window; the matrix on the right is the filter:
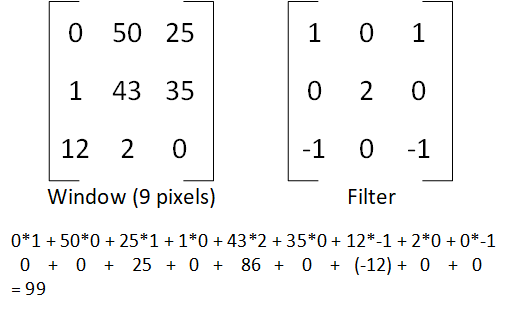
(Note: I use * to indicate simple multiplication here. That symbol is sometimes also used to indicate convolution instead of multiplication.)
Next, we slide the window over one pixel and do it again. Picture the window shown above: if we slide it over one, the leftmost column will disappear and the middle and right columns will shift over by one, and there will be one more new column on the right.
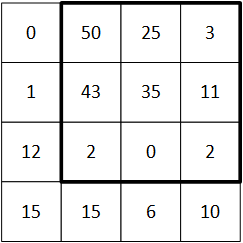
We now do the calculation again for this new window position, and we get 119 as the answer. (I’ll let you work out how I got that.)
The window has now been slid all the way to the right, so, like an old-fashioned typewriter, we move back over the left edge, but down one row.
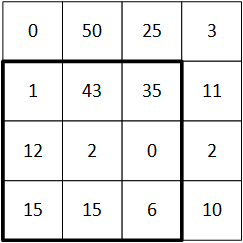
This time we calculate 19. Then we finish by sliding the window over to the right again, which gives us 29 (which I haven’t illustrated, but you should be able to confirm). (Weird that they all end in 9… there’s nothing magic about that… I truly just made up the numbers.)
Connecting to Convolution
So the thing that connects most strongly to the abstract mathematical notion of convolution is the sliding window thing. From an intuitive standpoint, that’s the easiest connection to envision. We’re not going to dive any deeper into it; this was just to give a feel for what this funky function is all about, since it’s absolutely everywhere in the ML world.
Depending on the filter, this helps us to identify various features in the image. Yeah, not obvious…
If this has you scratching your head a bit, not to worry. When I learned about convolution in engineering school years ago, no one bothered to try to explain how it worked or what it was good for or anything vaguely intuitive. The calculus version of the function was presented, and that was that. You didn’t question it; you just worked with it. It was highly unsatisfying to me, and remains so to this day.
We’re going to look at one other (and simpler) mathematical concept next week. We do this to motivate the kinds of hardwareIn this context, "hardware" refers to functions in an IoT device that are built into a silicon chip or some other dedicated component. It's distinct from "software," which refers to instructions running on a processor. necessary to do these calculations efficiently.

Leave a Reply